
How Your Demo Gate Is Hurting Growth
Gating information behind a demo call inflates your CAC, shrinks your deals, and slows your pipeline. I built a model to show how much.


Most B2B SaaS companies treat their demo call as the gateway to everything.
Want to see pricing? Book a demo.
Want to see how it works? Book a demo.
Want to know how we work with your industry? Book a demo.
The logic seems sound. More demos = more pipeline.
But here’s what the data actually shows: you’re spending sales time educating people who could educate themselves while losing the ones who won’t wait.
The price you pay is higher CAC, smaller deals and less revenue.
Let me walk through how we can calculate this. Step by step.
You can also catch the summary of the article as video here.
A directional model
There is no single study connecting all the dots I’m about to show you. The research exists in pieces. I pulled from multiple sources, layered in patterns from my own SaaS implementations, and built the bridges between them.
Every number has a directional basis. Where I estimated, I’ll tell you. And all sources are linked.
With that said, let’s walk through it.
Not everyone who books a demo wants to buy
We start with why people actually book demos. The most important thing to notice here is that most companies that use “book demo” to answer questions they do not give out elsewhere (like pricing) attract very different intent levels.
Some will argue that “pricing” is not low intent. But in most cases it is, because buyers use it as an early indicator about if we should keep looking at a product. Our pricing page gets 13x more traffic than our demo page and is one of the most visited pages on our websites.
When a demo is booked because you do not show pricing, even when it’s a good-fit buyer, the signal is still not a strong buying signal. It’s an information signal with low conversion rates.
I mapped out 16 reasons with matching intent level. Here’s what I found:
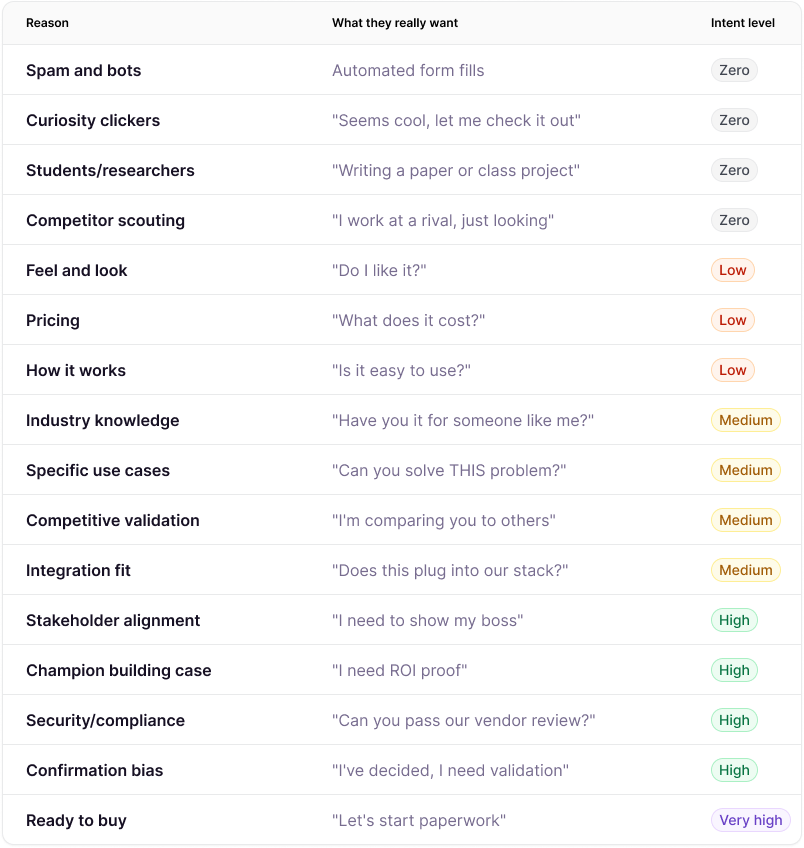
Look at that distribution. A huge chunk of your demos are low-intent information-gathering sessions. They’re not ready to buy. They shouldn’t need a 45-minute call with your AE to find out your pricing.
Intent level distribution in percentages
Knowing the reasons is useful. But to calculate the actual cost, we need to estimate how many demos fall into each bucket.
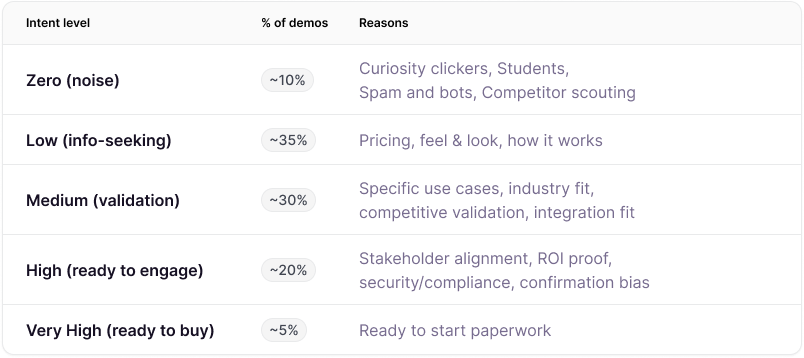
75% of your demos are with people who aren’t ready to buy. They’re gathering information that could be on your website.
The percentages are directional estimates. It comes from RevenueHero (1M+ demo requests), HockeyStack’s 2024 Benchmark Report (135 companies, ~$690M in spend), Maccelerator and patterns from my own SaaS implementations. But I wanna highlight this research in particular:
HockeyStack analyzed 31 million data points across 80 B2B SaaS companies. They only looked at transparent pricing vs gated pricing. What they found:
Transparent pricing generates 39% fewer form submissions but 1.7x more pipeline.
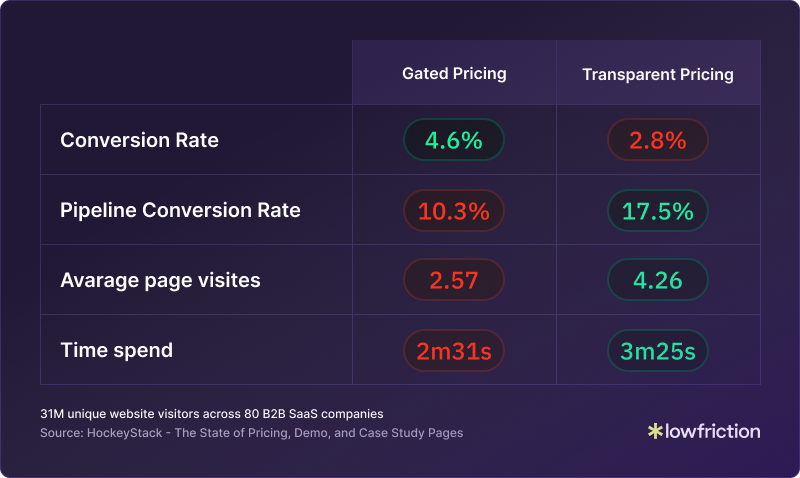
Fewer leads. Better quality.
Why? Because when you hide pricing, you attract “information” submissions. When you show it instead, you will see fewer bad-fit leads and more high-intent buyer submissions. That same effect applies to all self-serve content: High buyer friction dilutes quality.
What if you removed buyer friction from every demo entry point?
Let’s say you commit to lowering buyer friction across the board. You provide a self-service alternative for every question that currently requires a demo:
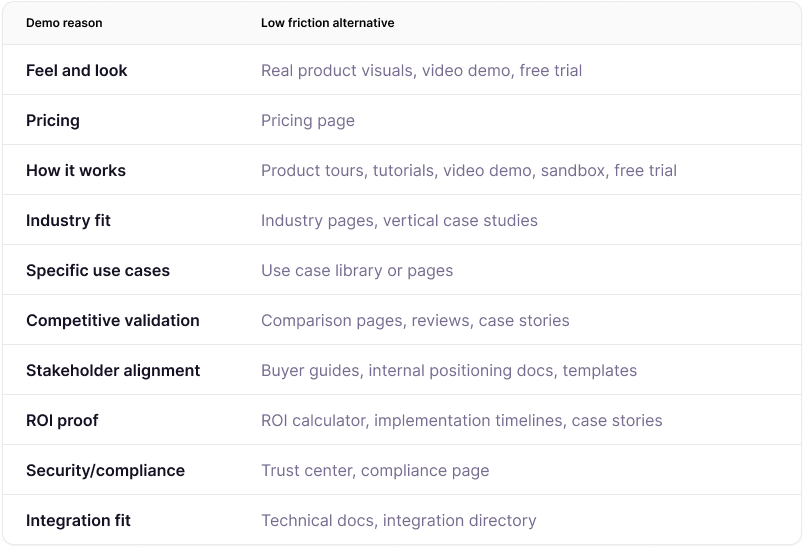
I excluded “Spam and bots”, “Curiosity clickers”, “Students/researchers”, and “Competitor scouting” because you don’t design your demo experience for those. But they will still be affected by the low-friction alternatives, which will keep some of them out of your demo funnel.
I also excluded “Ready to buy” because the lowest-friction path at that point is a human. A clear “Talk to a human” option covers it.
When you build low-friction alternatives for every demo-triggering question, and this happens:
A massive drop in demos from some intent categories.
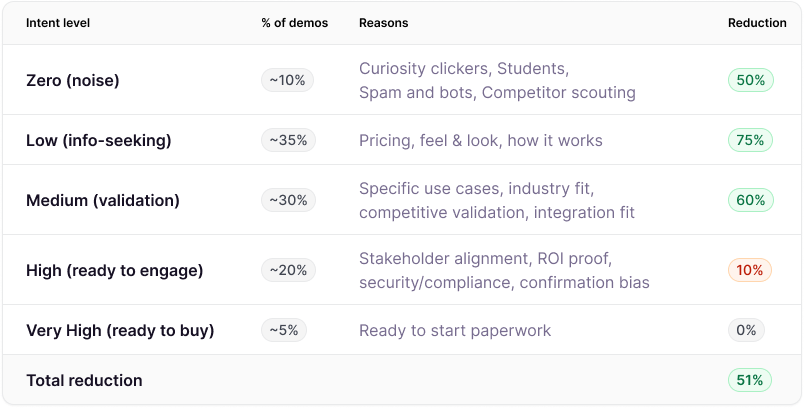
The reduction percentages are directional estimates based on this research, this one and own experience.
The number to keep an eye on is the 51% reduction in total. This means that if we had 100 demos in the old model, we would only have 49 left in this low friction alternatives model. The majority of the ones we remove are information-seekers and validation leads. It’s the ones we don’t wanna spend same time on anyway.
The triple multiplier effect
This affects lead quality massively. We’ve removed 51% of the leads from the baseline.
The ones that get through to a demo are more likely well-educated, high-intent buyers. And that has an impact on two more numbers:
Sales cycles get 30% shorter (Forrester 2023)
Deals are 2.8x more likely to close at a higher deal size (Gartner B2B Buying Report 2023)
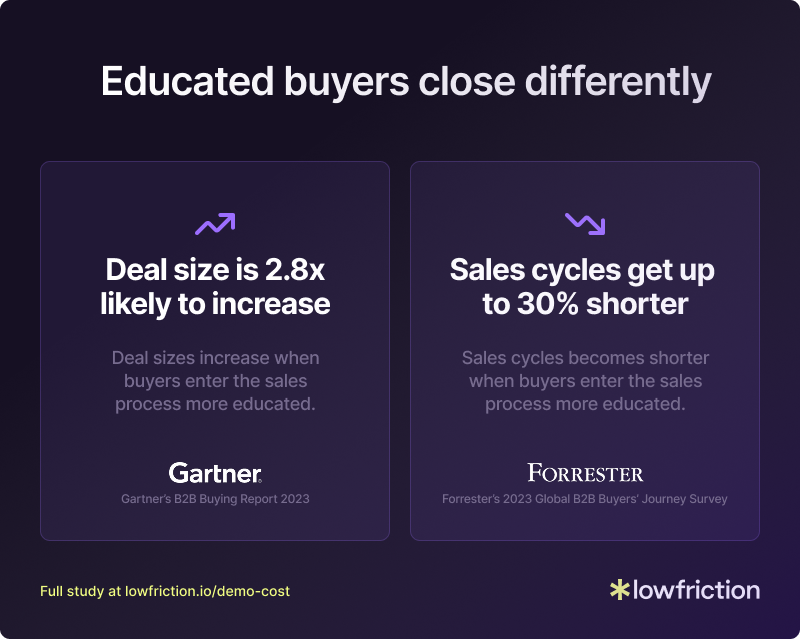
That “2.8x more likely” is a likelihood multiplier, not a price multiplier. It means educated buyers are three times more likely to close at a higher price point. Not that they pay three times more. I’m translating that into a conservative 15% ACV uplift. When buyers already know what they need before the demo, they commit to bigger packages with more confidence.
Educated buyers close faster. Spend more. Waste less of your sales team’s time.
These effects compound.
Let’s do the math for both models
We’ll track 100 people who need information as a cohort over 90 days. We’ll compare two models:
Demo-gated model: No self-service. Everyone needs a demo to get answers.
Self-service model: Comprehensive self-service content. Sales only talks to qualified, high-intent buyers.
Baseline assumptions:
Average sales cycle: 84 days (Optif.ai‘s 2025 benchmark of 687 companies)
Average deal size: €26K (SaaS Capital’s 2025 survey of 1,000+ private B2B SaaS companies)
Intent level distribution matches the table higher up
Win rates for each intent level:
Zero 0%
Low 5%
Medium 15%
High 40%
Very High 80%.
No research breaks down win rates by demo intent. What exists are blended B2B SaaS benchmarks that typically land between 20-30%, with a median around 21%. I’ve distributed that range across the five intent levels based on a simple logic: someone who booked a demo to check pricing closes far less often than someone ready to start paperwork.
The blended win rate in my model comes out at 18%. That’s below the benchmark range, and it should be. Most benchmarks count qualified opportunities. My cohort counts everyone who books a demo, including zero-intent noise and low-intent information seekers.
One important simplification. I’m using the same win rates in both models. In reality, the self-service model should produce higher win rates because buyers who reach a demo are better educated. But changing win rates and volume at the same time makes the comparison harder to follow and easier to challenge. So I held them constant to isolate the one variable that matters: the quality of demos, not just the quantity.
This means the numbers below undercount the real gap between the two models.
Model 1: Demo-gate.
100 people, 100 demos, 18 deals
Without self-service, every question requires a sales conversation.
All 100 people book demos. Sales talks to everyone, regardless of intent level.
The number of people comes from the Intent level distribution table. It shows what percentage of the 100 comes from each intent level.
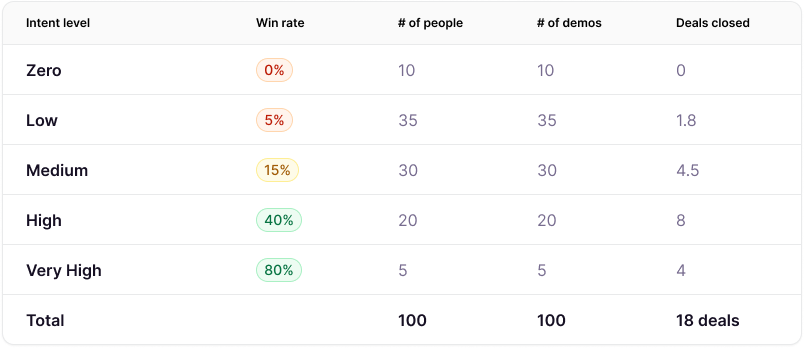
Result: 100 demos produce 18 deals over 84 days.
Model 2: Self-service.
100 people, 60 demos, 18.5 deals
With comprehensive self-service, people get answers without sales time. Bad fits self-disqualify. Lower-intent buyers research until they hit the right intent to reach out. High-intent buyers book demos right away. And you will always have some who book a demo no matter their intent level.
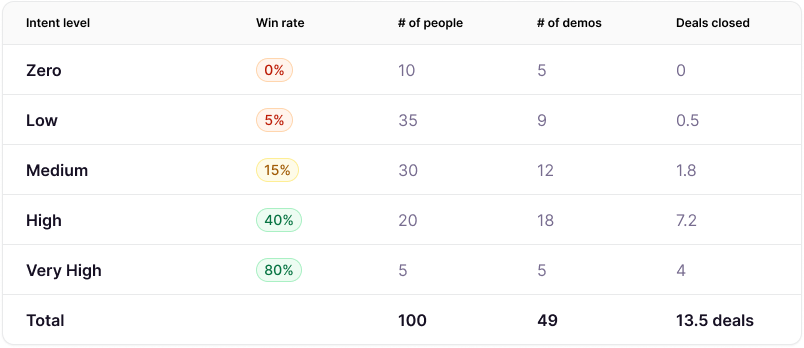
49 demos instead of 100. The other 51 people who now didn’t book a demo don’t disappear. They self-serve. And they split into two groups:
Self-disqualifiers (40 people)
They find their answers on your site. Realize it’s not a fit. Leave without consuming sales time.
5 Zero-intent: Were never going to buy
21 Low-intent: Price too high, features don’t match, timing wrong
13 Medium-intent: Found a better-fit solution, discovered an internal problem
1 High-intent: Budget pulled, no buy-in
Self-educated buyers (11 people)
They research independently. Build internal cases. Compare options. Mature from lower intent to ready to buy. Return for demos when they are ready to talk.
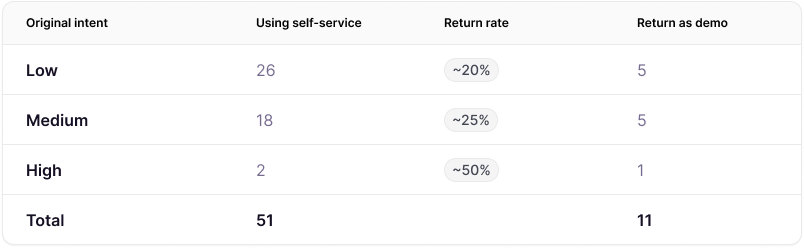
11 Self-educated buyers return as High or Very High intent. They close at 45% (blended high-intent win rate). 11 demos produce 5 additional closed deals.
These return rates are educated estimates. No research tracks how many self-service buyers come back for demos by original intent level.
The logic: higher original intent means a higher likelihood of return. Someone who came in at low intent and found the pricing too high is unlikely to come back. Someone at high intent who just needed one more answer probably will.
The 11 new demos is added to the 49 and the 5 new closed deals to the 13.5 existing.
Result: 60 demos produce 18.5 deals over 84 days.
Sales cost baseline
The last thing to add to our comparison is sales costs. The main argument here is that you spend too much time serving people who are not ready to buy. That is what hurts your CAC. So to put economics behind it, we need to understand sales costs.
This is our baseline:
Fully loaded AE cost: €100K/year (€48/hr). Wellfound puts the average B2B AE salary at ~€99.8K before benefits and overhead, so this is on the conservative side.
Average demo time: 1.5 hours (including prep and follow-up). Gong analyzed 67,149 demos and found winning and losing demo time average 47 and 36 minutes for the live call. Add prep and follow-up and you’re at 1.5-2 hours total.
Cohort comparison
Here is the full comparison from the 2 cohorts.
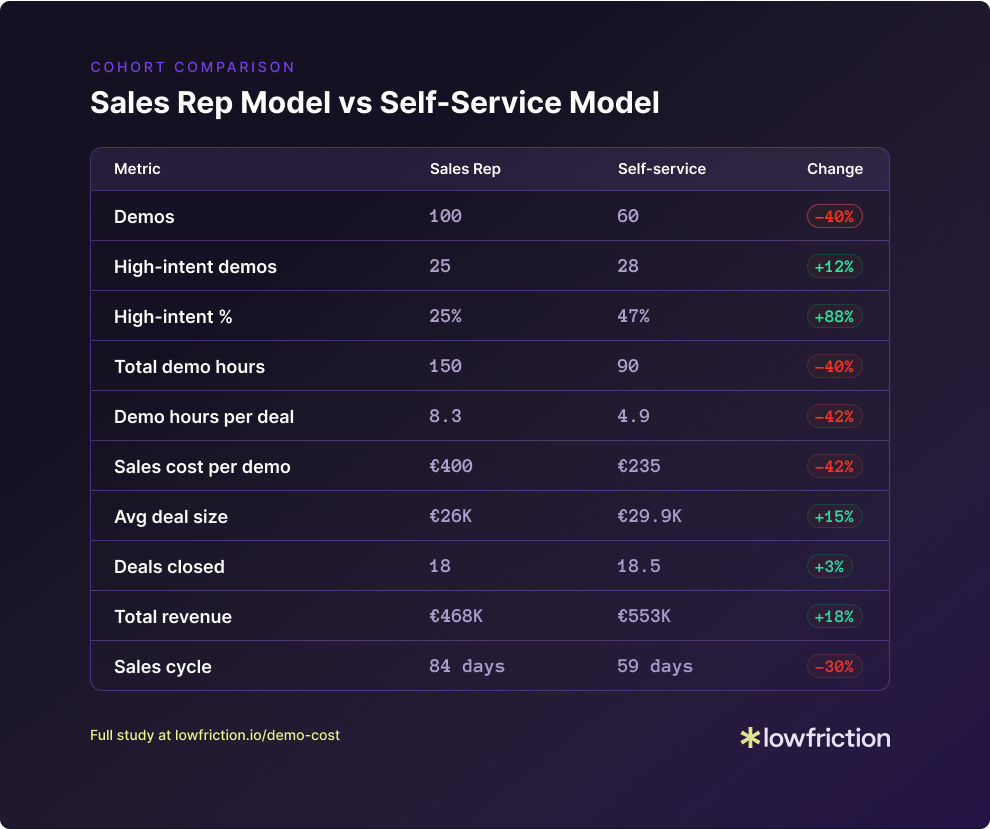
What this actually means
By the end of 90 days, both cohorts produce roughly the same number of deals. But the economics are completely different:
Lower CAC. You spend 42% less sales demo time per deal. That’s real margin.
Larger deals. Educated buyers close bigger at the estimated 15%. They know what they want and are willing to pay for it.
Faster cash. A 30% shorter sales cycle means you collect revenue a month earlier. That’s cash flow.
Shorter CAC payback. If your sales part of CAC drops 42% and deal size rises 15%, you recover acquisition costs faster. That’s the number investors and CFOs care about.
More revenue. 18% more from the same input. With less effort.
This isn’t about doing more with less. It’s not about keeping leads from sales. It’s about growing profitable at the path of least friction.
In the era of “growth at all costs,” you could ignore this. Fill the funnel. Hire more AEs. Figure it out later. In the era of profitable growth, this is the difference between scaling and stalling.
So why isn’t everyone doing this?
I see two reasons:
Marketing isn’t measured on revenue. Their job is to create leads for sales. By every measurable angle, the high-friction model looks better. It generates more leads. You can’t fix this until you stop treating marketing and sales as separate entities with different goals and understand the full buyer journey’s impact on your business
Revenue leaders were trained on playbooks where early sales intervention was the goal. Buyer behavior and SaaS economic models have changed, but moving away from what worked earlier is difficult, especially when this new playbook isn’t considered best practice.
This is a strategic decision revenue leadership must make. The biggest objection I still hear:
“Our business will suffer if we don’t capture leads and instead give away our pricing and more.”
I’m here to tell you it’s not true.
If you don’t believe me, listen to the market leaders.
I ran a study of the 50 fastest growing companies of 2025.
50 out of 50 subscribe to the low-friction self-service model.
Not most of them. ALL of them.
Buyers want this.
The market leaders are doing it.
Why aren’t you?
The upside I left out
I tried to stay true to the numbers in each model. I didn’t add the 2 effects I’ve seen every time I’ve been part of making a buying journey self-served:
More inbound leads.
People like your brand more. They appreciate transparency. Your valuable content now affects search rankings (especially AI citations) which drives more great converting traffic. All of those effects will result in more inbound leads.
Cleaner pipeline.
Everyone feels the pressure of getting deals in, so reps add deals they hope will close, even when they know better. This bloats your forecast, breaks your percentages and wastes time on low-intent leads. With the self-service model, there are fewer bad deals to work on.
These are real bonuses, not included in the model above.
A last note on the numbers
These aren’t lab-tested figures. There’s no single study that connects all these dots (yet). This is a directional model. Built from the research that does exist combined with industry experience and informed estimates.
My goal wasn’t to hand you a CFO-ready ROI deck. It was to show that the model behind low friction self-serve works. Even when you adjust the inputs.
So challenge it.
I’m building a calculator where you can input your own numbers. If you want it when it’s done, write me at soren@lowfriction.io.
I’m part of a community of marketers who believe removing friction builds better businesses. If you find evidence otherwise, I want to know.
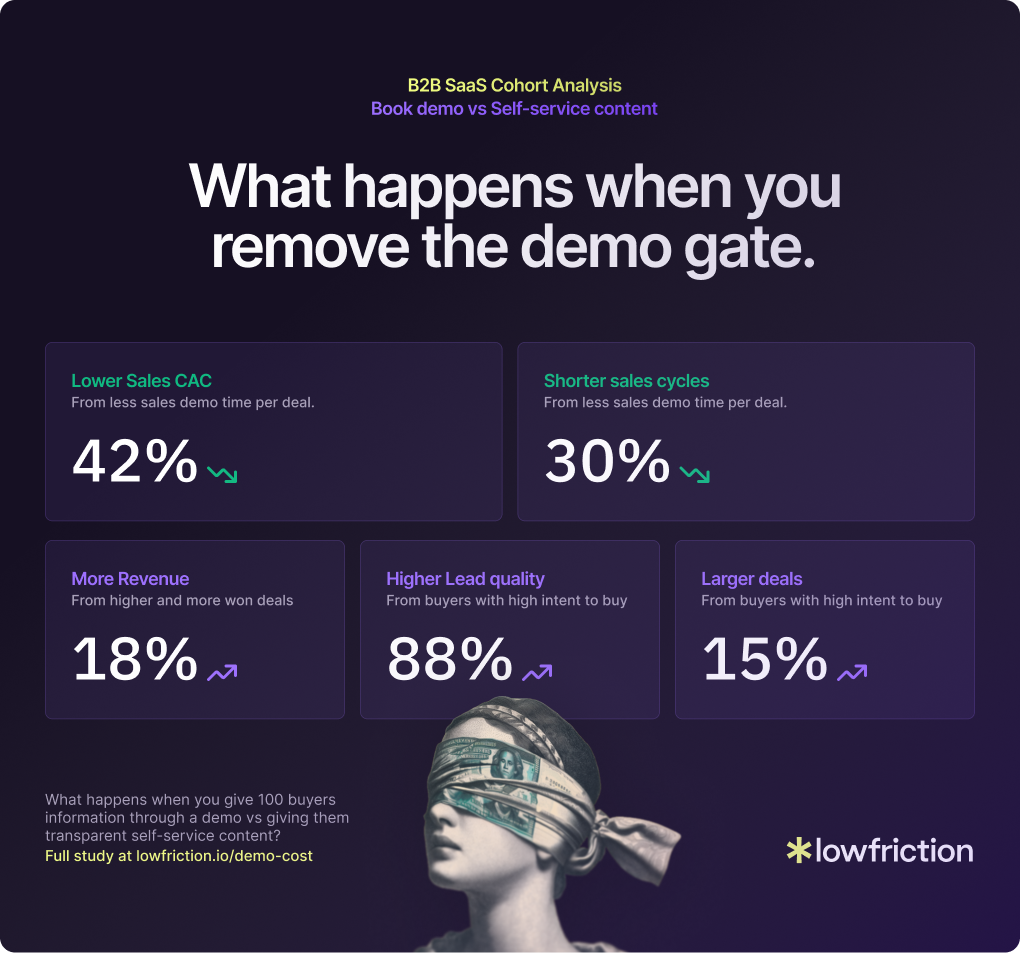
Conclusion: Your demo gate doesn’t protect your business. It hurts it.
The cohort analysis tells a clear story: Both ways produce similar deal volume over 90 days. But that’s also the only metric that is close.
40% less sales time
15% larger deals
30% shorter sales cycles
18% more revenue
The question isn’t whether you can afford to lower the friction for your buyers.
It’s whether you can afford not to.
I totally agree and love the modelling here. The hardest part is getting buy-in from leadership for even experimenting with it. Because you need to create a separate landing and ensure you split the traffic. Another part - coordinating outbound with sales (what lp do they share).
How do you handle convos with leadership and actually make the experiment work? And what’s the timeline for both models to have enough data and proof?